Keep in touch! Sign up to get updates and occasional emails from me.
15 May 2007


13 May 2007
What makes a place great?

"It's surprisingly simple.
Over the past 30 years Project for Public Spaces has evaluated more than 1,000 public spaces, and informally investigated tens of thousands more. From all this we have discovered that most great places--whether a grand downtown plaza or humble neighborhood park--share four key qualities:
1. It is accessible and well-connected to other important places in the area.
2. The space is comfortable and projects a good image.
3. People are drawn to participate in activities there.
4. It is a sociable place where people like to gather, visiting it again and again."
Read more.
Please share your thoughts.
Keep in touch! Sign up to get updates and occasional emails from me.
07 May 2007
Ice breaker
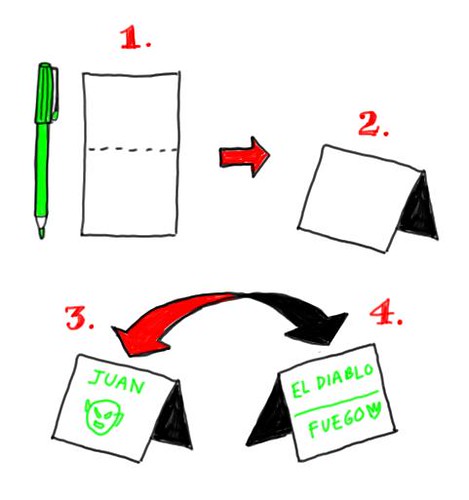
Here's a simple but effective way to break the ice and introduce people at your next meeting or event. It's a good way to get people into a brainstorming/creative mood and sets the tone for a creative meeting.
1. Give everyone an index card and a colored marker (it's better if everyone has a different color).
2. Have each person fold the card in half to make a table tent.
3. On the front, have them write their name and draw their "supermask" (as in, if they were a superhero, what would be their mask?).
4. On the back, have each person write their "supername" and "superpower."
5. Go around the room and have each person describe their card to the group.
Variations:
1. If everyone more or less knows each other: After writing their name, have each person pass their card to the person on their left or right. The person receiving the card fills it out and passes it back. Then go around the room as before.
2. Instead of "supername" and "super power" you can try other things, like "wrestler mask, name and secret move."
3. Corporate version Have each person draw a self-portrait on the front of the card, and on the back write something others are unlikely to know about them.
We did this at a recent edition of visual thinking school and it really livened up the meeting. Here are the results.
Give it a try, and post your cards to the vizthink! pool.
Keep in touch! Sign up to get updates and occasional emails from me.
02 May 2007
The most important technique of presenting
"Look your listener in the eye. Most inexperienced speakers lose the attention of their audience by looking up at the ceiling to collect their thoughts, looking at the floor, or darting their eyes around the room.
Whether you are addressing a small or large group, lock your gaze on one person, and keep it there for about five seconds - long enough to complete a thought. Then look at another person, take a breath, and continue with your next thought.
If you are talking to only one person, you'll want to break eye contact once in a while to avoid staring. But looking at one person per thought, and pausing slightly between each thought, is the most important technique of presenting."
-- From How to shine at presentations by Kevin Daley, founder of Communispond.
Keep in touch! Sign up to get updates and occasional emails from me.
23 April 2007
22 April 2007
Drawings are conversations
"A drawing is a conversation with yourself."
-- Vitor Higgs, infographer
Keep in touch! Sign up to get updates and occasional emails from me.
19 April 2007
Sketches of Morrocco
Beautiful sketches of Morrocco by Enrique Flores Here's another one.
Keep in touch! Sign up to get updates and occasional emails from me.
18 April 2007
Website on a dry-erase board?
 Click the picture to read more.
Keep in touch! Sign up to get updates and occasional emails from me.
15 April 2007
Self-Governing Workshops and Offices
 Conflict
No one enjoys his work if he is a cog in a machine.
Resolution
Encourage the formation of self-governing workshops and offices of 5 to 20 workers. Make each group autonomous- with respect to organisation, style, relation to other groups, hiring and firing, work schedule. Where the work is complicated and requires larger organisations, several of these work groups can federate and cooperate to produce complex artefacts and services.
From A Pattern Language by Christopher Alexander
Keep in touch! Sign up to get updates and occasional emails from me.
Tooth mapping
 This graph is a visual record showing the health of a patient's gums.
The red dots indicate bleeders that appear as the dentist probes the gums for their health. The graph-like bars that over-lay the teeth are measures of the gaps between the teeth and the gum.
Keep in touch! Sign up to get updates and occasional emails from me.
Five secrets of the curious infographic
 These are notes from a talk given at Malofiej 15 by Graphics Editor Marcello Valoncini.
1. Look forward. Don't stop with the news, simply reporting what has occurred.
2. Reach out. Don't be shy; call people and ask for details.
3. Watch TV. Look to the television medium for ideas and particulars.
4. Compare elements. Even if they seem absurd at first, comparisons help people understand things in a larger context.
5. Use the internet. It can deliver strange, funny or useful elements to enhance your story.
Keep in touch! Sign up to get updates and occasional emails from me.
06 April 2007
What is an infographic?
 This year's Malofiej competition is notable because for the first time ever, an interactive graphic was the only winner for the "best in show" award.
This sparked a lot of conversation about "what is an infographic?" As infographics go online, the line between infography and software begins to blur. Where does infography end and interface design begin?
About a week ago I had an interesting conversation with Juan Velasco, Graphics editor of National Geographic, where we tried to answer some of these questions. It's the beginning of a manifesto -- can you help us make it better?
WHAT IS AN INFOGRAPHIC?
1. It's a visual explanation that helps you more easily understand, find or do something.
2. It's visual, and when necessary, integrates words and pictures in a fluid, dynamic way.
3. It stands alone and is completely self-explanatory.
4. It reveals information that was formerly hidden or submerged.
5. It makes possible faster, more consistent understanding.
6. It's universally understandable.
Please add your comments and thoughts.
Keep in touch! Sign up to get updates and occasional emails from me.
05 April 2007

20 March 2007
Why you can't dial in to free conference call services
 If you have a Cingular/AT&T phone, you may have noticed that you have trouble dialing in to free conference call services. That's because Cingular -- your service provider -- is blocking your calls.
Cingular spokesman Mark Siegel says it's not a consumer freedom issue, it's about economics.
I say it's a good time to switch your services, so Cingular can understand the economics of treating their customers this way.
Read more here.
If you want to get out of your Cingular contract, here are some tips:
- How to get out of a cellular service contract
- Get out of your cell phone contract
- Celltrade: A service that helps you change providers
- How to get out of a cell phone contract
Keep in touch! Sign up to get updates and occasional emails from me.
17 March 2007
What’s next in visual communication?
 This article was originally published in Infonomia, a Spanish magazine. Read it in Spanish here.
Two million years ago, the first distinct and recognizably human cultures emerged. These early humans – known as Homo Erectus, or upright man – made and used complex tools, formed societies, migrated over long distances, used fire, and cooked food – and they did all that without words.
These early humans had 80% of the brain capacity of modern humans, and yet they were biologically incapable of speech. They communicated with each other visually, through gestures, observation and mimicry.
It wasn’t until much later – 25,000 years ago – that the first evidence of advanced drawing and painting skills appears, in cave paintings, such as the beautiful and famous examples at Altamira in northern Spain.
Then, 6,000 years ago, writing appears. Paper was invented by an administrator (anyone surprised by that?) about 4,000 years later.
The combination of writing and paper made it possible to share complex information over long distances. For example, explorers could make and share maps, sketches and detailed records of their discoveries.
In 1440 the publishing industry was born when Johannes Gutenberg invented the printing press. For the first time, written works could be mass-produced. Books became cheaply available.
With the printing press, words were much easier to reproduce than images: roughly 100 alphanumeric characters can convey nearly any idea, whereas every visual image must be uniquely created. There were other restrictions as well: words must be carefully set in lines and columns. Occasionally images could be inset to illustrate the text but all had to be carefully positioned according to a grid.
The printing press gave birth to a powerful industry. Monarchies crumbled as the voice of the people, through pamphlets and tracts, could now compete with the voices of priests, kings and queens. The industrial age of publishing reached its peak with the massive, global entertainment industry in the late 20th century.
Today, entertainment giants such as Fox, Viacom, Disney and Sony dominate global culture because they control most of what the world sees and hears. This in turn gives them tremendous influence over what the world thinks and feels. But their days are numbered, and they know it. In the 21st century, and communication has entered a digital age. Publishing power, like computing power, gets cheaper and cheaper all the time. Eventually, both computing and publishing power will be as cheap and plentiful as paper is today.
It started in 1984, when Apple introduced the Macintosh computer and the first graphical user interface (GUI). For the first time, ordinary people could interact with a computer visually: with window, icons, folders, trash bins. People who had never considered themselves “computer people” now had access to a powerful tool for creative endeavors, which allowed them to do things they could never have done before.
Individuals could now become publishers. With very little investment they could design their own business cards, brochures, logos, even magazines. It was called desktop publishing, and professional publishers were horrified.
The world will never be the same, they said. Without professional training, people will abuse this power. And they were right. Bad design proliferated. Badly designed logos, badly designed brochures, badly designed newsletters, badly designed magazines, became the norm, when once they had been the exception.
Publishing involves both the creation and delivery of information. The desktop publishing revolution solved the creation problem, but in 1984, to deliver a magazine you still needed to print it and mail it, and to deliver a video you needed to broadcast it. And those things were expensive.
But in 1991, Tim Berners-Lee invented another revolution in visual communication: the web browser. Today, because of the web browser, you can publish your ideas to the world for the price of an internet connection.
The cost of creating and publishing information is plummeting inexorably towards zero.
The publishing industry has counted on people’s laziness, their willingness to be led, and their willingness to be fed information. This is the same mistake that established authorities have made since the beginning of time.
They fail to realize a critical fact: the ability to play with tools drives literacy, and the more literate people are, the more involved they become.
Children play with paper and pencils in order to learn how to draw and spell. And as people played with their computers they began to develop their visual communication skills. And playing with digital communication tools like the internet drives visual literacy.
Today, we are free once more. Paradoxically, now that everything has been reduced to zeros and ones, our only limit is our imagination. What’s interesting is that we continue to constrain ourselves to the grid, even when it is no longer necessary. The conventions of printing, which once liberated ideas by making them mass-producible, have now become a prison.
So what’s next? Watch the kids. In the 1970s we started playing video games, and although we didn’t know it at the time, we were learning how to interact with digital technologies. We were learning the hand-eye coordination skills we would need to operate the computers of the 1980s.
The toys of today are the tools of tomorrow: blogging, podcasting, photosharing, videoblogging – these are all early indicators. People are making their own movies and publishing their ideas to the world. With every passing year the technology gets cheaper and easier to use.
What we are seeing today on the internet is the emergence of a truly global culture, a culture that communicates visually. People around the world are playing with visual thinking toys, and their visual literacy is slowly rising.
We’re in the process of learning how to communicate visually – we’re witnessing the emergence of a global visual language. I am very happy to be a part of it.
Keep in touch! Sign up to get updates and occasional emails from me.
Subscribe to:
Posts (Atom)