Charts and graphs are powerful tools to make information more visual and engaging. But when you are describing something really new or different, charts and graphs may not be enough.
For example, when early explorers returned from distant lands, they had to describe all sorts of strange and unusual creatures; things people had never seen before. On occasion they would describe them to artists who would attempt to depict them visually. Here are a couple of examples:


In this case the pictures depict elephants, and they were created purely from verbal descriptions. You can see from these pictures that even talented visual artists can have trouble visualizing something really new or different, something they had never seen before.
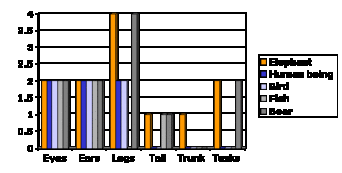
Now, imagine you were an explorer, and that you needed to explain what an elephant was using charts and graphs. It might look something like this (Click to enlarge picture):
How the elephant differs from other animals

Do you think the chart is getting the real point across?
Today’s world is changing at a breakneck pace. Often the things we are challenged with communicating are complex, new and different – we are often trying to explain things that are really new or different; things they have never seen before.
And still we attempt to convey these ideas using charts and graphs. Charts and graphs are a wonderful way to visualize complexity; they are powerful tools for depicting rich sets of data; but there are times – and they come more and more often these days – when a chart is not enough.
Remember: when you have something really new or different to convey; something people have never seen before – draw them a picture. Your audience will thank you for it.
Keep in touch! Sign up to get updates and occasional emails from me.
2 comments:
Brilliant illustration, I agreed with the concept before reading this pieve, but you given me an entirely new way to look at it and communicate it to others. Thanks for opening my eyes.
Thanks. Please, pass it along!
Post a Comment